Team project · CPSC 482, UNBC
DSM Optimizer
Reorders a project's task-dependency matrix to cut rework loops, in C++17.
With Simon Kraft and Joshua Payne.
Problem
A Design Structure Matrix lists the tasks in a project, with a mark wherever one task depends on another. Marks above the diagonal are feedback marks: a task that depends on work scheduled after it, which means rework.
Reordering the tasks can remove many of those marks. We measured two things: the number of feedback marks (FBM), and their total distance from the diagonal (TFBD).
What I built
A six-stage pipeline in C++17 that reads a sparse matrix and returns a reordered one. We tested it on 10 benchmark matrices, from 11×11 up to 27,770×27,770.
How
- ParseMatrix Market into compressed sparse columns
- SCC decompositionTarjan's and Kosaraju-Sharir's algorithms
- Condense and sortContract each SCC, then Kahn's topological sort
- TearingEades-Lin-Smyth Algorithm GR inside each SCC
- BandingReverse Cuthill-McKee, then adjacent-swap hill climbing
- PermuteApply P^T A P and verify the result
Tasks in a strongly connected component depend on each other, so no ordering can clear every feedback mark among them. Contracting each component gives a DAG, and a topological sort of that DAG leaves feedback marks only inside the components.
Tearing then approximates a minimum feedback arc set inside each component. The hill climbing step accepts a swap only if TFBD drops and FBM does not rise.
Results
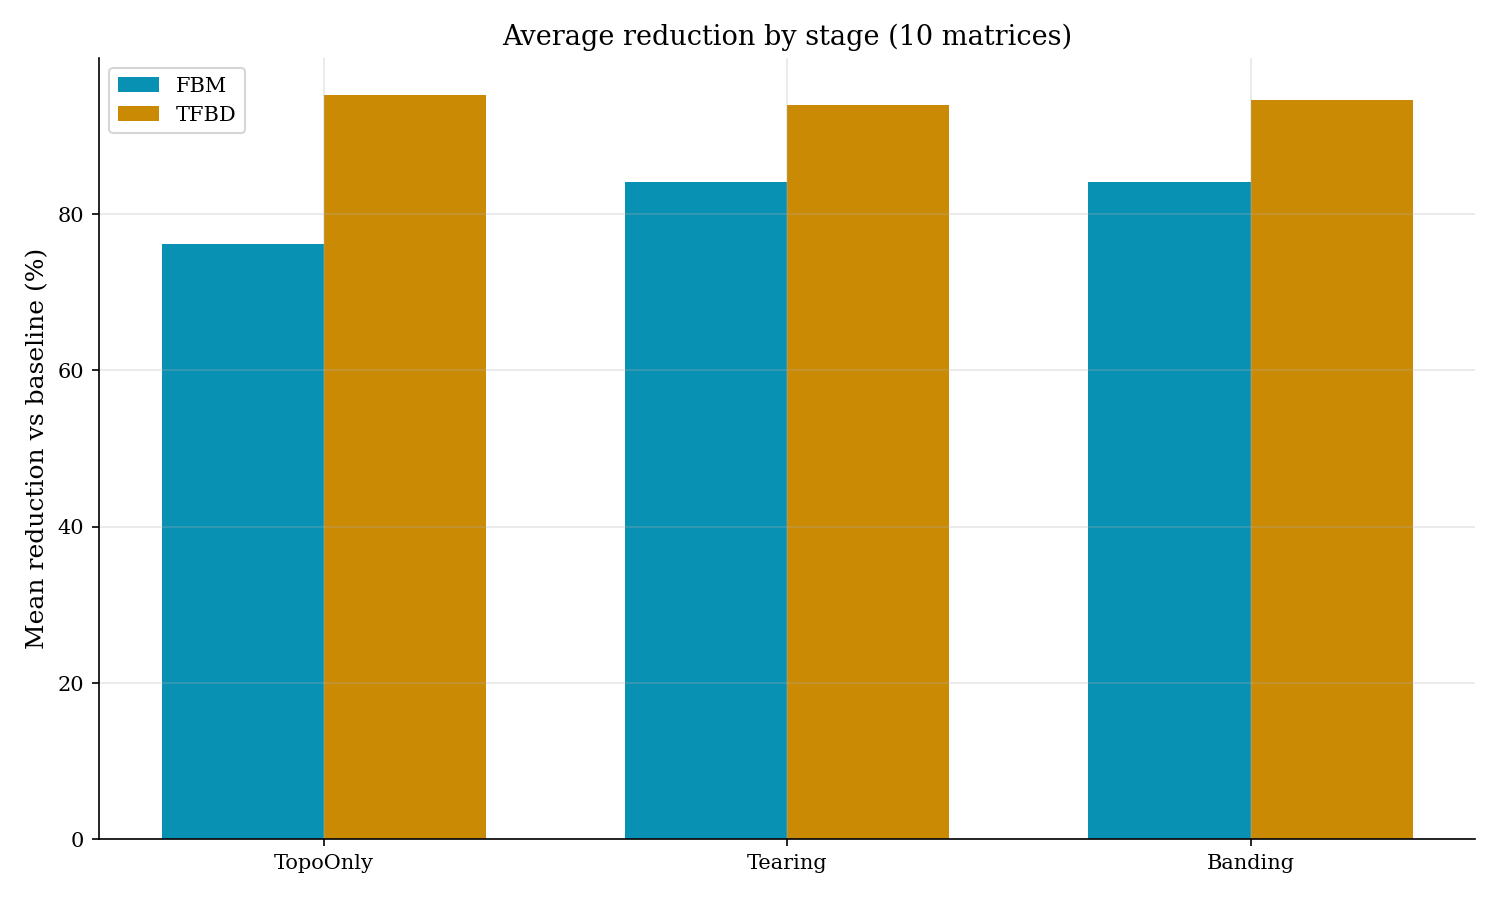
- 84% average FBM reduction and 94.54% average TFBD reduction across the 10 matrices.
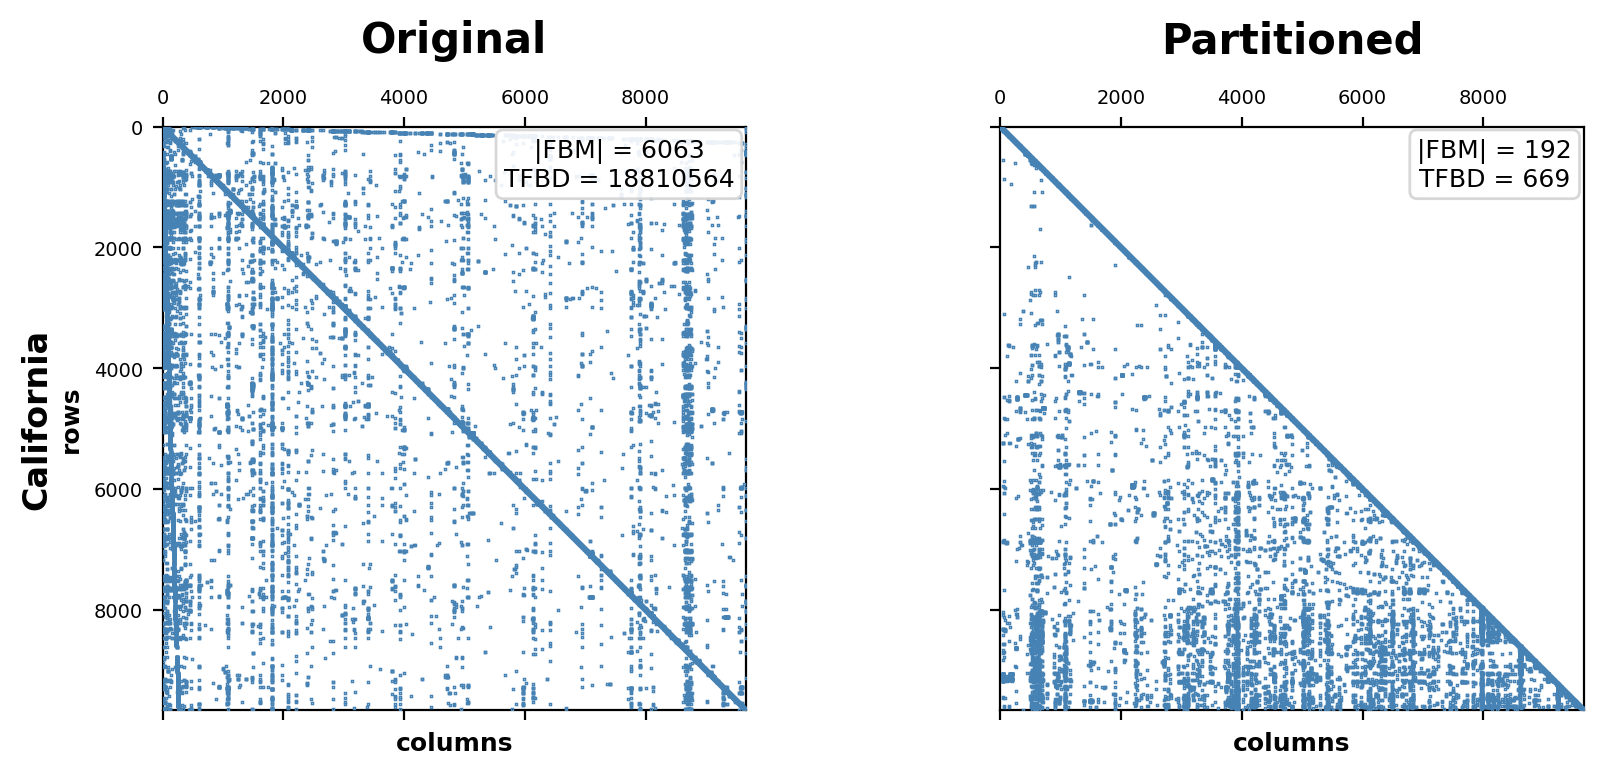
- On California (9,664 tasks), FBM fell from 6,063 to 192 and TFBD from 18,810,564 to 669.
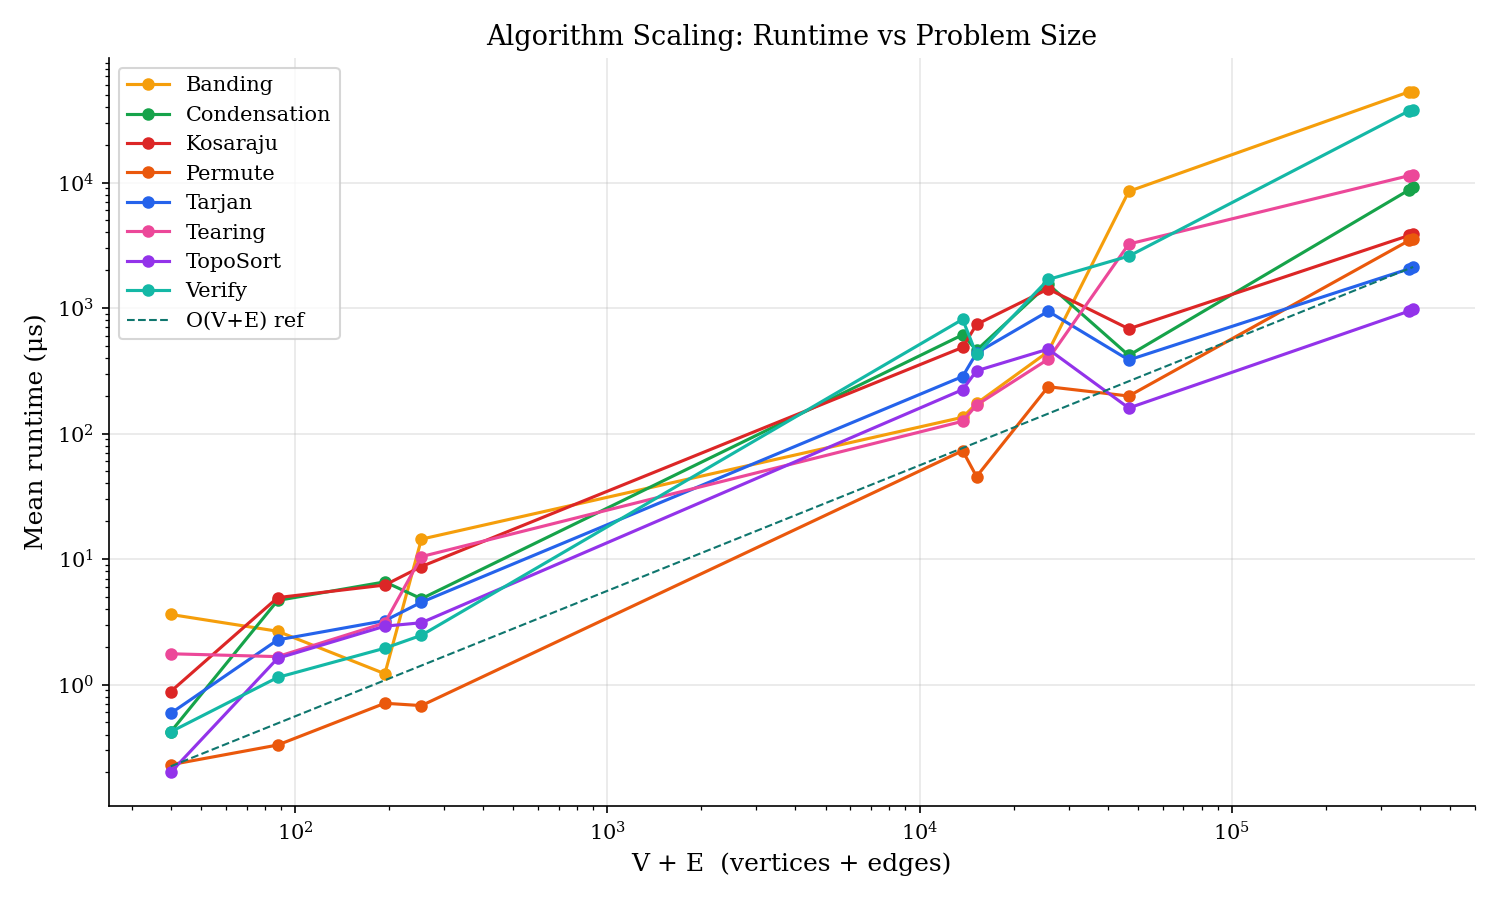
- Tarjan ran about 1.8× faster than Kosaraju.
- Most of the gain came from SCC condensation plus topological sort; tearing added about 8 points of FBM reduction, and banding barely moved either metric.